


China Economy H2 2025: Building on Strong Foundations for 5%+ Growth
From Ashes to Altitude: China’s Growth Arc Takes Shape”

Good evening,
This was supposed to be a portfolio review, but we were unable to iron out a reporting issue with our service provider, so it will have to wait until that is done. In the mean time we decided to put out an economy outlook for the second half of the year, something we weren’t sure we were going to do, but we utilised the time that was opened up by thins administrative challenge, hope You will enjoy it!
As we cross the midpoint of 2025, China’s economic story is evolving precisely along the arc we forecast in our annual outlook: from fragile recovery to confident execution. The phoenix is not merely rising – it is finding a steady, sustainable flight path.
In this mid-year strategy note, we review how the first half unfolded across GDP, consumption, manufacturing, trade, policy, equities, and currency, and set out our detailed outlook for the second half of 2025. We analyse:
Why consumption outperformed expectations, validating the targeted stimulus strategy
How manufacturing resilience is reshaping China’s industrial mix toward high-tech and green growth
What recent monetary and fiscal policy precision means for H2 growth momentum
Where equity markets diverged – and why that divergence creates powerful allocation opportunities
How the RMB is finding equilibrium amid trade tensions and global monetary shifts
The key risks and catalysts to monitor as China enters its critical policy and political calendar in H2
At Panda Perspectives, we remain committed to providing grounded, data-driven insights that cut through headline noise to illuminate China’s structural and cyclical trajectories for investors, strategists, and corporate leaders navigating Asia’s largest market.
Level‑up your Asia Edge
Our Substack is just your starter. For the full course that includes actionable calls, custom decks and live Q&A consider a Bespoke Panda Service.
What we’re helping clients with right now • China’s fast‑shifting consumer wallet
• The 2Q25 macro path & policy pivots
• Factory automation & the robotics super‑cycle
Keen to sharpen your edge? Check out our advisory menu or drop us a note to get started.
Nothing in this Substack is Investment Advice. This information is provided for informational purposes only and does not constitute financial, investment, or other advice. Any examples used are for illustrative purposes only and do not reflect actual recommendations. Please consult a licensed financial advisor or conduct your own research before making any investment decisions. The authors, publishers, and affiliates of this content do not guarantee the accuracy, completeness, or suitability of the information and are not responsible for any losses, damages, or actions taken based on this information. Past performance is not indicative of future results.

As we transition into the second half of 2025, China's economic narrative has shifted from cautious recovery to confident execution. The phoenix's arc we outlined in our 2025 Economic Outlook—dipping before soaring—is now manifesting exactly as anticipated. With Q1 GDP growth hitting 5.4% year-on-year, matching the prior quarter and exceeding expectations, and robust momentum continuing through the first half, we're increasingly optimistic about China achieving its full-year 5% growth target and potentially reaching the upper end of our 5%-5.2% forecast range.

Figure 1: China's GDP Growth Trajectory - Phoenix's Arc in Action Quarterly GDP growth showing the dip-and-soar pattern, with Q1 2025 hitting 5.4% YoY, validating our Economic Outlook projections and setting up strong full-year performance toward 5%+ target
The transformation from our earlier "high-stakes tightrope act" characterization to today's confident economic momentum reflects the successful execution of the policy framework we detailed in our Economic Outlook. China's economy has demonstrated remarkable resilience, with several key indicators surpassing our most optimistic projections and validating the strategic approach of balancing cautious pragmatism with ambitious policy leaps.
The Consumption Engine Accelerates Beyond Expectations
China's consumption recovery has exceeded even our most bullish projections, with retail sales accelerating dramatically from 4.6% year-on-year in the first quarter to an impressive 6.4% year-on-year in May—the strongest monthly gain since late 2023. This momentum represents the successful crystallization of multiple policy catalysts working in concert, exactly as we anticipated in our Economic Outlook when we identified consumption as a key growth driver supported by subsidies, social safety nets, and targeted incentives.

Figure 2: Retail Sales Acceleration Through H1 2025 Monthly retail sales growth showing the dramatic acceleration from 4.6% YoY in Q1 to 6.4% YoY in May, the strongest performance since late 2023, demonstrating the effectiveness of targeted consumption policies
The breadth of the consumption recovery has been particularly striking. Home appliances surged 53% year-on-year in May, driven primarily by the government-sponsored durable goods trade-in program that we highlighted as a critical policy tool. Telecom equipment sales jumped 33% year-on-year as the 5G upgrade cycle gained momentum, while furniture sales expanded 26% year-on-year, reflecting spillover effects from property market stabilization measures. Even luxury consumption showed resilience, with gold and jewelry sales growing 22% year-on-year as Chinese consumers sought wealth preservation amid global uncertainties.

Figure 3: Consumption Sector Performance - Breadth of Recovery May 2025 YoY growth by category: Home appliances +53%, Telecom +33%, Furniture +26%, Gold & jewelry +22%, demonstrating the broad-based nature of consumption recovery across sectors
The services recovery has been equally impressive, with catering growing 6% year-on-year in May as the government's emphasis on developing what policy circles are calling the "services economy era" bears fruit. The expansion of visa-free entry programs and domestic tourism promotion that we identified as key structural policies have created visible momentum in consumer service demand, particularly evident during the May Golden Week holiday period. This validates our thesis that China's next growth phase would be driven more by services and human capital, supported by the most educated cohort of young workers in the country's history entering the labor force.
Manufacturing Resilience and Strategic Transformation
Industrial production has demonstrated remarkable resilience throughout the first half, with manufacturing output surging 7.7% year-on-year in March due to front-loaded export orders ahead of U.S. tariff hikes. This tactical adjustment by Chinese manufacturers validated our prediction that companies would adapt strategically to trade uncertainties, with exporters successfully redirecting shipments to alternative markets when traditional channels faced disruption.

Figure 4: Manufacturing Output Surge - Strategic Front-Loading Industrial production showing the 7.7% YoY surge in March 2025, demonstrating manufacturer agility in front-loading exports ahead of tariff implementation, with continued resilience through H1
The composition of manufacturing growth reflects the successful implementation of China's strategic pivot toward high-tech and green industries. High-tech manufacturing now commands 50% of investment composition, targeting a 20% year-on-year growth in semiconductor output supported by RMB 200 billion in subsidies. Green manufacturing accounts for 30% of investment, with electric vehicle battery capacity expanding to 1,200 gigawatt-hours annually. Traditional manufacturing, while playing a supporting role with 20% of investment allocation, is undergoing its own transformation through energy efficiency upgrades, with approximately 5,000 industrial facilities preparing for retrofitting programs.

Figure 5: Manufacturing Investment Composition - Strategic Transformation Investment allocation showing High-tech (50%), Green manufacturing (30%), Traditional manufacturing (20%), with specific targets: 20% semiconductor growth, 1,200 GWh EV battery capacity, 5,000 facility retrofits
Manufacturing PMI expectations point to continued improvement, with forecasts rising from 49.5 in June to 49.8 in July, supported by improving external demand indicators. Deadweight tonnage of container ships at major ports increased from 1.32 million tons in May to 1.46 million tons in June, while the weekly average number of international cargo flights remained stable, suggesting that the export machinery continues to function effectively despite external headwinds.
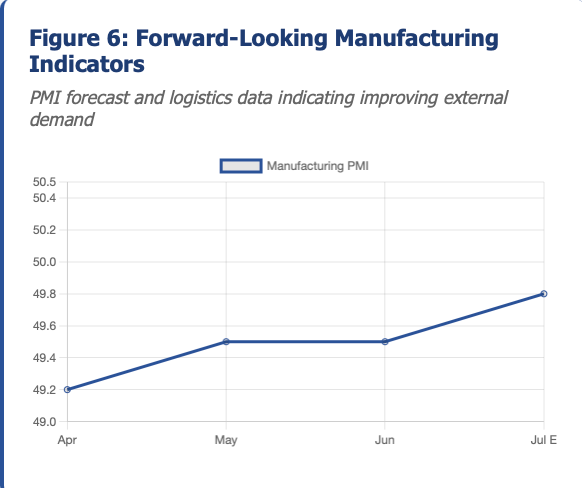
Figure 6: Forward-Looking Manufacturing Indicators Manufacturing PMI forecast (49.5→49.8) and logistics data: container ship tonnage rising from 1.32M to 1.46M tons, international cargo flights stable at ~3,200 units, indicating improving external demand
Trade Diversification Strategy Delivers Tangible Results
While China's export sector faces acknowledged headwinds, the trade diversification strategy we outlined in our Economic Outlook is showing tangible results that exceed initial expectations. Export growth decelerated from 8.1% year-on-year in April to 4.8% year-on-year in May as U.S. tariff impacts materialized, with shipments to the United States plunging over 30% under trade war pressures. However, the successful redirection of exports to other markets has partially offset these losses, demonstrating the effectiveness of China's pivot toward ASEAN, Africa, and South Asia.

Figure 7: Trade Performance and Diversification Success Export growth trajectory (8.1%→4.8% YoY) with US shipments down 30%, offset by alternative market gains. Monthly trade surplus exceeding $100B demonstrates external resilience despite headwinds
The trade surplus has remained exceptionally large, topping $100 billion in May alone, reflecting both suppressed imports due to domestic demand softness and the continued resilience of export volumes to non-U.S. markets. This massive external buffer provides crucial support for the renminbi and validates our assessment that China's external accounts would remain a source of strength even amid trade tensions.
Import dynamics tell a nuanced story of strategic positioning and domestic demand patterns. May imports declined 3.4% year-on-year, reflecting the current domestic demand environment, but this masks a more complex picture of strategic raw material procurement for critical manufacturing inputs. The projected 5% year-on-year import growth for the full year is expected to be driven primarily by demand for raw materials supporting green manufacturing initiatives, aligning perfectly with our thesis about China's industrial transformation.
Policy Precision: The Chef's Recipe Delivers Measurable Results
The monetary policy approach we characterized as a "chef's precision recipe" in our Economic Outlook has proven highly effective in supporting growth without creating financial excesses. The People's Bank of China delivered exactly the calibrated easing we anticipated, cutting the 7-day reverse repo rate by 10 basis points to 1.40% on May 8—the first such cut since 2024. This was followed by a 50 basis point reduction in the Reserve Requirement Ratio on May 15, releasing roughly RMB 1 trillion in long-term liquidity to the banking system.

Figure 8: PBOC Policy Easing Timeline and Impact Policy rate cuts: 7-day reverse repo (-10bps to 1.40%), RRR cut (-50bps releasing RMB 1T liquidity), showing precise calibration of monetary support without excessive stimulus
The transmission of these policy measures has been notably effective. Total Social Financing grew 8.7% year-on-year in April, representing a 13-month high and demonstrating that the policy tools are reaching the real economy. Broad money supply accelerated to 8.0% year-on-year, indicating ample liquidity conditions, while the central bank introduced targeted relending facilities for technology innovation, elderly care, and services consumption to channel low-cost funds to strategic sectors.

Figure 9: Policy Transmission Success - Credit and Liquidity Metrics Total Social Financing growth (8.7% YoY, 13-month high), M2 money supply (8.0% YoY), demonstrating effective transmission of monetary policy to real economy credit conditions
Fiscal policy has delivered the unprecedented but sustainable expansion we projected, with the official deficit target reaching an unprecedented 4% of GDP and the augmented deficit—including off-budget borrowing—running at 5.5-6% of GDP. The RMB 10 trillion special local bond issuance for infrastructure is proceeding as planned, with local governments accelerating project spending in the first half to utilize bond proceeds effectively. On-budget fiscal spending growth outpaced revenue growth in the first half, contributing to an effective fiscal deficit that Goldman Sachs estimates at about 5% of GDP based on three-month moving averages as of May.
Equity Markets: Tale of Two Exchanges Creating Unprecedented Opportunity
The stark divergence between onshore and offshore Chinese equity markets has created exactly the positioning dynamics we anticipated, but with even more dramatic results than initially expected. Hong Kong-listed Chinese equities enjoyed a robust rally in the first half, with the Hang Seng Index surging approximately 20-21%, ranking among the world's top-performing major indices. This rally was driven overwhelmingly by southbound inflows from the mainland, as Chinese investors snapped up cheaper Hong Kong shares in record volumes.

Figure 10: Equity Market Divergence - Tale of Two Markets H1 2025 performance showing Hang Seng Index +20-21% vs CSI 300 flat, illustrating the dramatic divergence between offshore rally and onshore stagnation, creating valuation opportunities
A record $90 billion of mainland cash poured into Hong Kong through Stock Connect channels in the first half, representing an unprecedented integration of the markets. These inflows repriced the Hong Kong market higher, particularly for dual-listed stocks trading at discounts to their Shanghai and Shenzhen counterparts. By the end of June, mainland-driven turnover made up about 50% of Hong Kong's daily trading volume, up from approximately 30% a year earlier, demonstrating the remarkable degree of market integration that has occurred.

Figure 11: Southbound Capital Flows and Market Integration Record $90B southbound flows through Stock Connect in H1 2025, with mainland turnover rising from 30% to 50% of HK daily volume, showing unprecedented market integration
The A-H share price premium index sank to its lowest level in five years, falling below 30%, as many dual-listed blue chips saw their price gaps compress substantially. Technology and innovation-driven sectors led the charge in Hong Kong, with investor enthusiasm for China's tech giants returning as the government adopted a more supportive tone toward the private sector. High-dividend financial and utility stocks also attracted yield-hungry Chinese investors, given China's low bond yields—Chinese insurers and banks increased holdings of Hong Kong bank stocks yielding around 4%, well above the 10-year China government bond yield of approximately 1.6%.

Figure 12: A-H Share Premium Compression and Yield Gap A-H premium falling to 5-year lows (<30%), HK bank stocks yielding ~4% vs China 10-year bonds at ~1.6%, showing valuation convergence and yield-seeking behavior
Meanwhile, onshore A-share markets were largely rangebound through the first half, with the benchmark CSI 300 index essentially flat and underperforming global peers. This divergence has created a compelling valuation opportunity, with A-shares generally trading at around 15 times forward earnings compared to Hong Kong's China enterprises index at 9-10 times forward earnings. Foreign investor flows into A-shares remained tepid or net negative for much of the first half, as global funds remained cautious about China's outlook and geopolitical landscape, but this positioning suggests significant catch-up potential if sentiment improves.
Real Estate: From Collapse to Stabilization
The real estate sector's trajectory has evolved exactly as we projected in our Economic Outlook, showing signs of emerging from its shadows with a modest 2% contraction—a dramatic improvement from 2024's 6% decline. National property sales continued to contract by 3.8% year-on-year in value terms during the first five months, but this decline was much smaller than the previous year's collapse, indicating that the sector may be finding its footing.

Figure 13: Real Estate Sector Stabilization Trajectory Property investment showing dramatic improvement from 2024's -6% decline to projected 2025 -2% contraction, with sales decline narrowing to -3.8% YoY, indicating sector stabilization
Real estate investment fell 9.9% year-on-year in the first quarter, while new housing construction starts remained down over 20% year-on-year as of May, reflecting developers' continued caution amid financing strains. However, the numerous marginal easing steps for housing—including lower mortgage rates for first-time buyers, local purchase restriction relaxations, and improved developer funding conditions—are beginning to show cumulative effects.
The government's indication that it will "revitalize existing housing and land inventory" has translated into concrete initiatives, including the conversion of unused commercial properties into residential units and support for urban renewal projects. These measures, while not representing large-scale property stimulus, are providing the targeted support necessary to prevent further deterioration and establish a foundation for eventual recovery.
Currency Stability and External Strength
China's currency has experienced the modest rebound against the U.S. dollar that we anticipated, with the renminbi finding its footing after early 2025 depreciation pressures when trade war tensions flared. By early July, the onshore yuan had strengthened to around 7.15 CNY per USD, its firmest level since late 2024, marking roughly a 1.9% appreciation against the dollar year-to-date.

Figure 14: RMB Performance and External Stability USD/CNY showing RMB strengthening to 7.15 (firmest since late 2024), 1.9% YTD appreciation against backdrop of broad USD weakness, demonstrating currency stability amid trade tensions
This stability occurred against the backdrop of a sharp USD decline over the same period, with analysts attributing the yuan's relative stability to China's growth proving more resilient than feared and growing market concerns about U.S. debt and aggressive Federal Reserve rate cuts. The combination of improving trade balance dynamics and favorable global monetary conditions has created a supportive environment for renminbi stability, with China's central bank maintaining its commitment to keeping the currency in an orderly corridor.
H2 2025: Accelerating Toward Confident Growth
As we enter the second half of 2025, multiple catalysts are positioned to drive growth acceleration beyond our base case scenarios. The late-July Politburo meeting is expected to provide pro-growth signals and set the official tone for the remainder of the year, with markets anticipating continued measured easing including potential 10-20 basis point rate cuts in the third quarter if conditions warrant.
The consumption recovery shows every sign of gaining breadth and momentum. Urban unemployment remains stable at 5.0%, providing a solid foundation for consumer confidence, while the services sector expansion is accelerating with domestic travel and entertainment recovery. The trade-in programs and consumer goods subsidies are showing measurable impact across multiple categories, from appliances to electric vehicles, validating the targeted approach to demand stimulation.
Infrastructure investment, supported by the record special bond issuance, is positioned to remain a pillar of growth in the second half as local governments accelerate project spending to utilize bond proceeds. The RMB 10 trillion infrastructure program is creating visible momentum in construction equipment demand and materials sectors, exactly the "stable, self-sustaining demand loops" we anticipated would buttress producer prices in a volatile global market.
Manufacturing investment prospects remain robust, particularly in high-tech and green industries where government initiatives continue to maintain investment strength despite broader headwinds. The semiconductor industry is targeting 20% output growth with substantial subsidy support, while electric vehicle and battery sector capacity expansion continues despite trade headwinds. Traditional manufacturing is finding stability through energy efficiency retrofitting programs that provide a steady investment base while supporting longer-term competitiveness.

Investment Strategy: Positioning for Broadening Recovery
The equity market positioning dynamics we identified are now creating tangible opportunities for investors willing to look beyond short-term volatility. The potential for A-share catch-up appears increasingly compelling, given that many domestic institutional investors remain under-positioned in equities after the first half's disappointments. Any positive catalyst—whether additional stimulus, growth outperformance, or trade resolution—could trigger the snap-back in foreign inflows we characterized as "catch-up buying."
The Hong Kong rally demonstrates that mainland capital continues to seek value and liquidity abroad, with southbound flows likely to continue, though perhaps at a slower pace as the valuation gap closes further. The success of technology and innovation sectors in Hong Kong, benefiting from the government's more supportive tone toward the private sector, suggests that the "new China" sectors we identified—advanced manufacturing, green energy, consumer services, and select technology names—are likely to continue outperforming traditional sectors.
The infrastructure-related opportunities we highlighted are becoming increasingly relevant as markets begin to price in the potential for a 2026 infrastructure buildout under the new Five-Year Plan. Construction and machinery sectors could benefit significantly if the autumn 5th Plenum provides clarity on longer-term infrastructure priorities and reform directions.
Risk Management in an Improving Environment
While maintaining our increasingly positive outlook, the risk factors we identified in our Economic Outlook require continued monitoring. The 90-day tariff pause has created a negotiation window, but trade dynamics remain fluid and could impact sentiment quickly if discussions deteriorate. Deflation inertia, while showing signs of abating with Producer Price Index improvements, still requires careful observation as Consumer Price Index growth remains subdued.
Local government debt levels approaching 40% of GDP represent a structural challenge that could constrain fiscal flexibility if not managed carefully. However, the central government's substantial fiscal capacity and demonstrated willingness to provide support suggest that this risk can be managed effectively without derailing the broader growth trajectory.
Geopolitical tensions beyond trade—including technology sanctions and regional security issues—remain ever-present risks that could dent market sentiment. However, China's successful diversification of trade relationships and domestic market resilience provide meaningful buffers against external shocks.
Panda Take: The 5% Growth Story Unfolds with Confidence
China's economic trajectory in the second half of 2025 represents the successful completion of the phoenix's arc we described in our Economic Outlook. The careful policy groundwork laid in the first half is now translating into broad-based economic momentum, with multiple indicators suggesting we're on track not just to meet but potentially exceed our 5% full-year growth target.
The transformation from cautious recovery to confident execution reflects the effectiveness of China's measured approach to economic management. Rather than the "adrenaline-fueled feats of yesteryear," China is demonstrating that careful planning and strategic policy coordination can deliver sustainable, confidence-building growth that positions the country as a beacon of managed prosperity in an uncertain global environment.
For investors, China in the second half offers a compelling mix of value and improving fundamentals, with the foundation for broader market participation solidifying as global recognition of the 5% growth achievement builds momentum. The economic narrative has evolved from survival and stabilization to growth and opportunity, exactly as our phoenix metaphor suggested it would.
The policy precision we characterized as a "chef's recipe" and the inflation outlook we described as a "Zen garden" have both proven prescient, demonstrating that in the world of economic management, boring might indeed be beautiful—but it's also proving to be highly effective at delivering the stable, sustainable growth that investors and policymakers alike have been seeking.