
Earning the Multiple: Why America Trades at 20x and China at 12x
A guest essay on what a valuation premium is actually made of, and why the gap between the two markets reads like a to-do list.

8 August 2026
Good morning.
In June we published Somewhere to Go, a guest essay by our founder Leonid Mironov on the realignment of Chinese capital, and it became one of the most impactful pieces in this publication’s history. At the very least it was the one that generated the most feedback. That essay ended on the valuation question and left it half-answered. This was by design, as a question of that magnitude requires addressing it in a separate piece. This piece is it. We asked Leonid to finish the thought, starting from the other end: what exactly justifies the much higher price in America, and is it at all repeatable, and if so, how? He kindly agreed. This is an evergreen-ish piece, so we are very fortunate to be able to send it out for a week when we are forced to take a short break from the blog for personal reasons. We can be kind and call it annual leave. In any event we hope you enjoy this piece, which we hope is at least thought-provoking, even if you don’t fully agree with its findings.
Now For a Legal Reminder: Leonid runs the China fund at Gavekal, and the views that follow are written in a strictly personal capacity. They are his own, not those of Gavekal or any affiliated entity, they are not research, and they are not produced for or on behalf of his employer or its clients. Panda Perspectives is publishing this piece because we think our subscribers will find it interesting, not because we endorse it or any view, security or strategy mentioned in it. Nothing here is an offer, a solicitation, a recommendation, or investment, legal or tax advice, and nothing in it should be relied upon as such. It takes no account of your circumstances, it may refer to positions the author or his fund hold or have held, and past performance is no guide to future returns. Markets carry risk, including the total loss of capital. Do your own work, and if you have comments or questions, take them up with Leonid directly rather than with us.
IMPORTANT NOTE: We are presently in the process of getting a license with a major regulator, and while that process is ongoing we are not able to publish the portfolio update and company notes. We’ll do a big reveal of the new plans as soon as we’re in a position to do thusly. We apologise for it taking time, but this is unfortunately a fact of life. With that we’re also putting the opinion part of this behind the wall.
NOTE: Panda+ is now closed to new joiners. We thank everyone for their interest and custom.
Nothing in this Substack is Investment Advice. This information is provided for informational purposes only and does not constitute financial, investment, or other advice. Any examples used are for illustrative purposes only and do not reflect actual recommendations. Please consult a licensed financial advisor or conduct your own research before making any investment decisions. The authors, publishers, and affiliates of this content do not guarantee the accuracy, completeness, or suitability of the information and are not responsible for any losses, damages, or actions taken based on this information. Past performance is not indicative of future results.
A guest essay by Leonid Mironov.
Good morning,
What a pleasure it is to be able to speak directly to the subscribers again! I hope you enjoy this essay as much as I did writing it. Please check out the first part available here:

And while you’re reading this please consider supporting the Pandas and becoming a full subscriber here, if you are interested in a spot of positive reinforcement.
On to the main event.
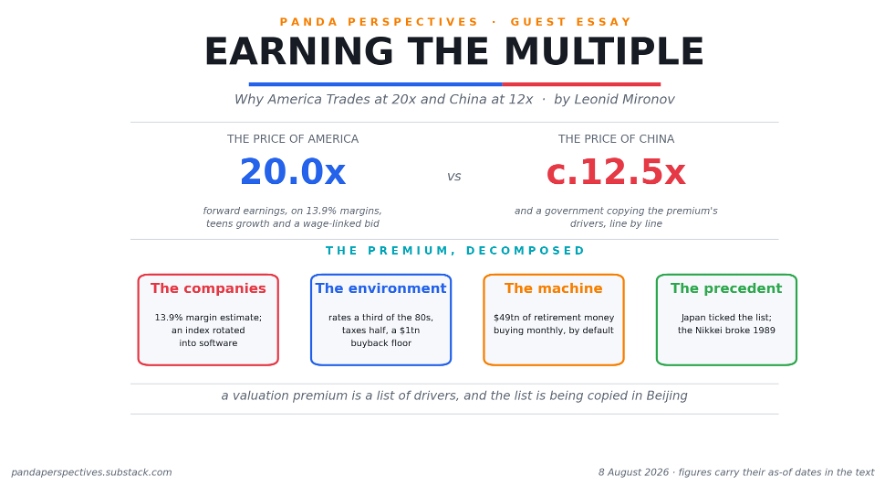
The S&P 500 trades at 20.0 times forward earnings as of 7 August, using FactSet’s data. Not quite the all-time high, but not far off. At the same time, MSCI China trades near 12.5 times, the Hang Seng an even more affordable 12 times and Japan around 17 times. If you want to be fancy and use a more sophisticated (kind of) metric like the Shiller CAPE, it crossed 42 in July, a level last seen in the summer of 2000. It seems like either one of the things can be true: America is a bubble or China and the rest of Asia are a generational opportunity (or a value trap, for the more negatively inclined). As usual I happen to believe there’s nuance and want to argue a somewhat differentiated reading of the situation. The American premium is, largely, earned and deserved. I intend to zoom in to the things behind this valuation one by one. Once you list the drivers you’ll see that it’s more of a blueprint, and arguably it’s actually quite well understood. Japan and Korea have clearly adopted some of the playbook already, and arguably they have had some success. Beijing, I will argue, is attempting to recreate the whole thing, and it is the only other country with the scale to try to do exactly that.
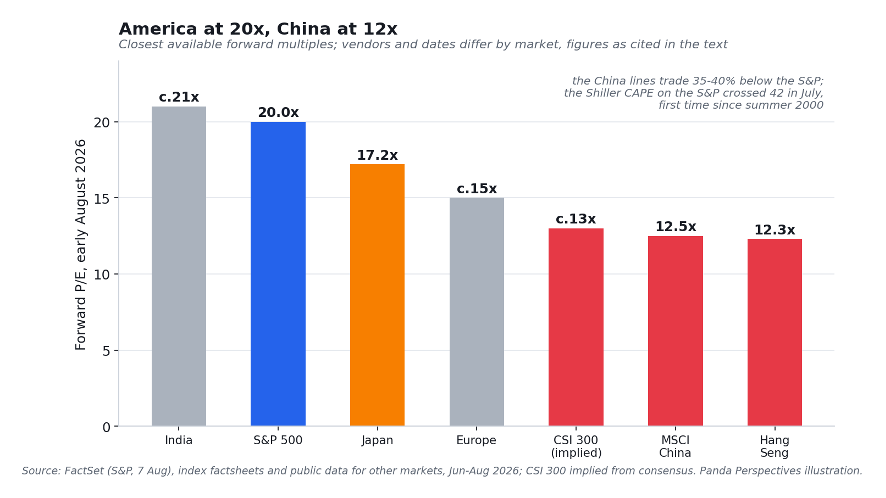
Before we dive in I think it important we establish some interesting facts. Like for example the S&P began 2026 near 22 times forward earnings on FactSet’s series and trades, as we mentioned at the top, at 20 times today. This despite the index moving higher over the period. Should not be a shocker, as all this means is that the earnings of the constituents are set to grow faster in the next 12 months than the market could reprice them. In fact forward estimates have climbed from $273 of 2025 earnings towards $320-340 for this year while the second quarter numbers delivered 32% growth, even after adjusting for one-offs. These numbers do make one feel quite old, as I recall discussing the aggregate S&P earnings dropping 77% in 2008 to $23 and whether they will ever hit $50 in our lifetimes. We needn’t have worried: the earnings kept growing, sometimes ahead sometimes behind the prices. We can quibble about the earnings quality and sustainability, but believe me we did that all the way through this run. The long and short of it is that the earnings are up a lot, and the expectations are that it’s not going to slow down in the near future.
In my last essay we discussed whether the supply of Chinese capital, the ability to deploy it productively and the returns to reward it are aligning for the first time in almost 20 years. We did close on a bit of a cliffhanger that this line of thinking raised: whether the prices already reflected it? In this essay I will try to approach the same question from the other side of the Pacific. What American prices are made of and is this in any way instructive for what China is trying to engineer? I am sure that the place to start is the companies themselves.
The companies earn more per dollar of sales than they ever have
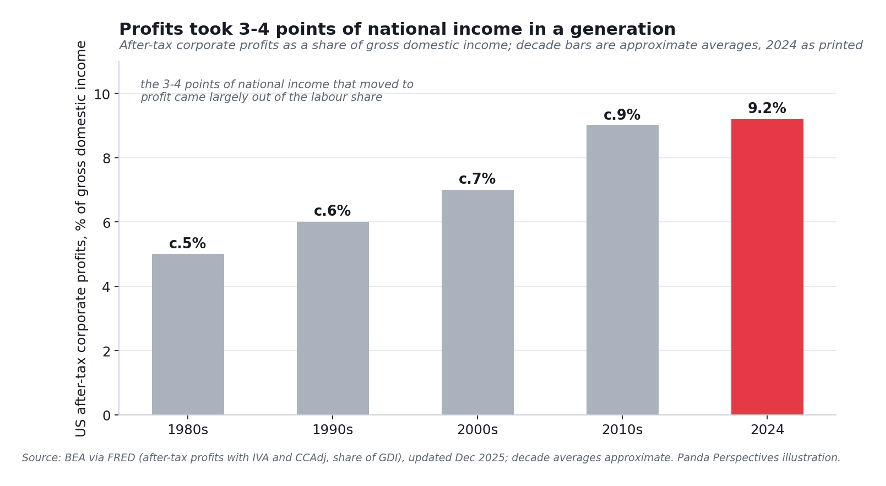
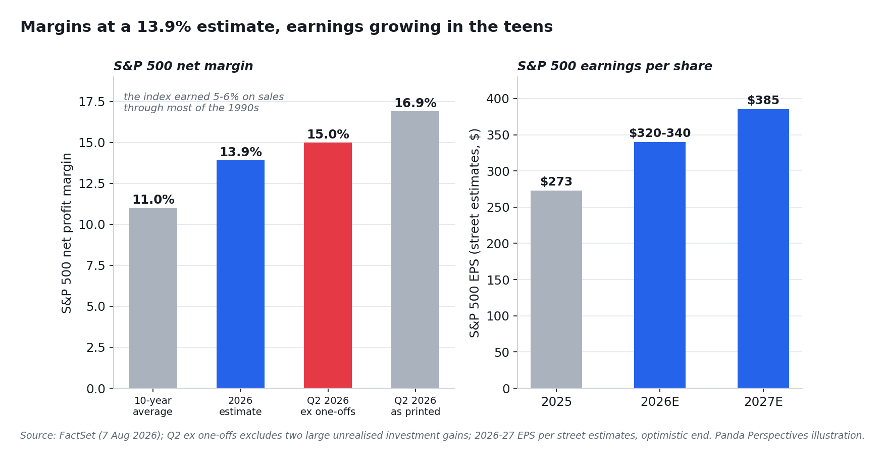
Start with margins, because margins are what the companies actually earn on the top line. Sticking with FactSet, their estimate for the S&P 500’s 2026 net margin is 13.9%, which would be the highest annual figure in the data. This also compares favourably against a 10-year average of 11.0%. More recently, the second quarter reports have shown a blended margin of 16.9%. Easy to attribute it to two enormous one-off investment gains at Alphabet and Amazon, but even stripping those out the underlying figure was 15.0%. Again, for the history buffs among us, the index earned 5 to 6 cents on the sales dollar through most of the 1990s. Put more academically, American profits have been taking a rising share of national income for a generation. After-tax corporate profits were 9.2% of gross domestic income in 2024 on the BEA’s accounts, against an average closer to 5-6% through the 1980s and 1990s, and the 3-4 points of national income that moved to profit came largely out of the labour share.
As we mentioned earlier, those earnings keep growing. Those very same second-quarter earnings were actually up 32% year on year even excluding the two one-offs. This was ahead of expectations with an 86% beat rate against a 78% five-year average. This was the seventh consecutive quarter of double-digit growth. Street estimates for 2026 earnings run from roughly $320 to $340 per share, with 2027 near $385 at the optimistic end, from $273 in 2025. If we were to look at it as a purely numerical exercise for a single company, surely this kind of earnings dynamic justifies a 20x multiple for next year earnings?
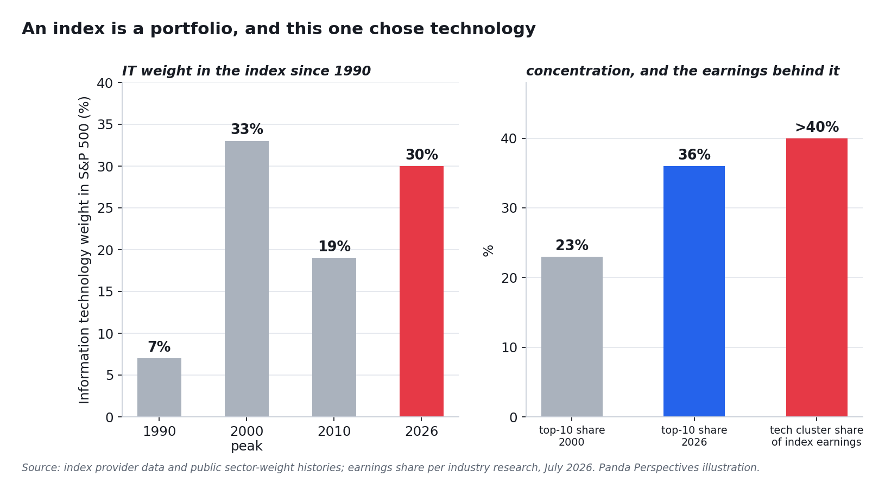
But it’s not a single company, I hear you exclaim. Sure, and so let’s consider the composition, which may go a long way towards explaining how we got there. Information technology was roughly 7% of the S&P 500 in 1990 on the index provider’s histories. Today the sector alone is near 30%, the ten largest stocks are 36% of the index against 23% at the 2000 peak, and the broad technology cluster produces more than 40% of index earnings. Since we established that an index is a portfolio, we can’t ignore the fact that the American portfolio has spent 35 years rotating out of steel and into software, platforms and other Internet-forward businesses.
But wait, there’s more! Ocean Tomo’s long-running study puts intangible assets at roughly 92% of S&P 500 market value, against 17% in 1975. Walmart booked $150bn of e-commerce revenue in fiscal 2026. McDonald’s took roughly $40bn of systemwide sales through digital channels last year. JPMorgan’s technology budget is heading for $20bn, larger than the revenue of most software companies. The conventional sectors bought the technology shift outright, so even the non-tech bit of the index is using that tech to be more productive and drive those margins.
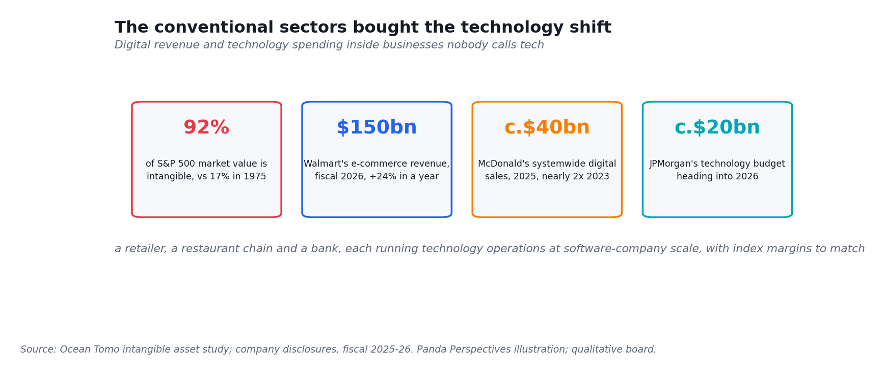
Now to be sure, there’s room for pushback: we can be sceptical of the stickiness of individual companies (Tesla, Carvana) or business model shifts, or AI outlook. But we can’t ignore the fact that the US corporate sector has excelled at adopting new technology and used it to help drive margin expansion. There were of course other reasons and other drivers, but I do believe this has been very important especially after 2018.
The environment is the kindest a listed company has ever operated in
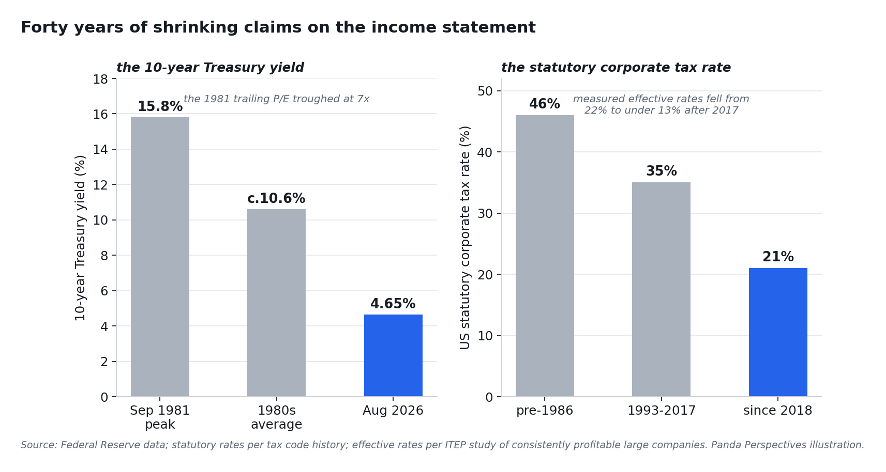
Next, the surroundings, and here I will ask the older readers to bear with me. A company selling at 20x today faces a 10-year Treasury at 4.65%. Its predecessor in September 1981 faced 15.8%, and the trailing multiple on the index that year bottomed at 7x. If you started your career after 2000 that first number will genuinely look like a typo. It was not, and a good chunk of the last 40 years of equity returns is simply that number hitting new lows. Even after the post-2022 rate reset the discount rate is less than a third of that in the 1980s. Taxes have likewise been very accommodative: 46% statutory before the 1986 reform, 35% for two decades hence and 21% since 2018. Companies are no schmucks, and don’t pay the statutory, but even then the measured effective rate for consistently profitable large companies fell from 22% to under 13% after the 2017 cut. A lot of it is now permanent including the full expensing of equipment and domestic research, that I know many of the readers are quite fond of.
Let’s consider what that does to an income statement. The two single biggest drags on the company’s ability to retain and reinvest or indeed return its earnings have greatly diminished. Surely this is good for a few points of a multiple uplift.
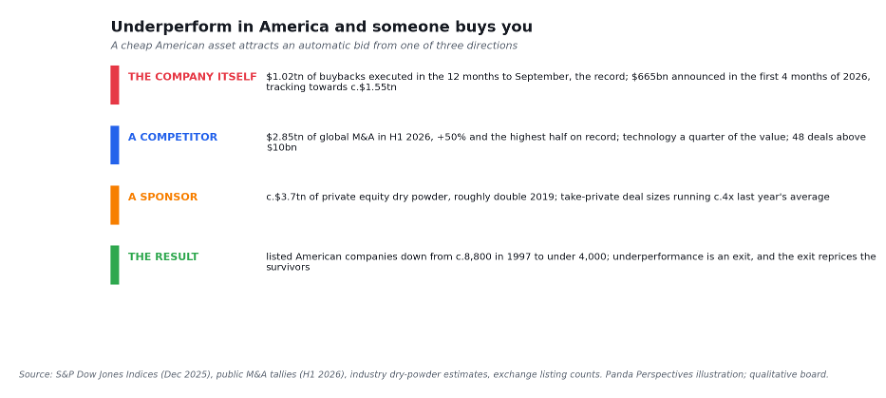
But once again that is not all, because what happens if a company underperforms in this paradise? Someone buys it, that’s what. Could be the company itself, could be a PE fund, could be a larger competitor. Either way there’s an implicit bid in the market for most companies if they are going through something. American companies bought back $1.02tn of their own stock in the 12 months to September, the largest figure in S&P Dow Jones’s records, and announced $665bn of new authorisations in the first four months of 2026, tracking towards roughly $1.55tn for the year per Bloomberg. First-half global M&A reached $2.85tn, up 50% and the highest half recorded, with technology a quarter of the value. Private equity held around $3.7tn of committed, undrawn capital entering the year, and the various roll-ups and consolidators are permanently on the hunt.
Meanwhile the pool those sharks fish in keeps shrinking: there are now fewer listed American companies than in the 1980s. Currently that number is under 4,000, down from roughly 8,800 in 1997. So a cheap, underperforming listed business in America does not stay cheap, underperforming and listed for very long. Management buys the stock in, a competitor buys the company, or a sponsor takes it private. I have watched this movie many times over the years, and the ending rarely varies. The multiple is high partly because the exit from a low multiple is now automatic, and again we can talk about the sustainability going forward, but this was certainly one of the drivers that got us here.
The investor pays almost nothing to participate
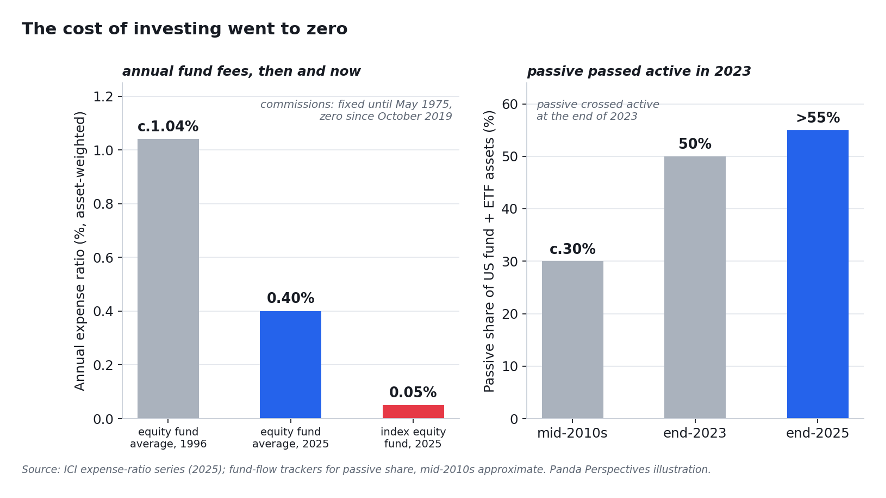
Now for my favourite part, which I think gets nowhere near enough airtime. In 1975 the New York Stock Exchange still ran fixed commissions, as it had since 1792. Deregulation that May started a 50-year decline in the cost of participation for most investors, that ended, literally, at zero when the large brokers abolished online commissions in October 2019. Nearer to my sell side youth, the spreads compressed when quotes went to pennies in 2001. The asset-weighted expense ratio on an index equity mutual fund is now 0.05%, per the ICI, down from levels ten times higher in the mid-1990s, and passive vehicles crossed 55% of American fund assets last year. A century ago the retail investor paid perhaps 2% to transact and 1% a year to hold. Today both numbers round to nothing, and anyone who remembers paying a broker $50 a trade in the 1990s, as I do, will appreciate how radical that is. Every basis point of removed friction is a basis point of return that stays with the saver and capitalised at market multiples the cumulative effect on asset values is enormous.
And again, it’s not that it’s all sunshine and rainbows, the passive shift has a lot of drawbacks, and we can argue the cheapness made some very problematic behaviour possible, but let’s just take a step back and acknowledge that for an average well-behaved investor this was a boon that encouraged greater participation, and thus another point on the multiple at the very least.
The machine invests the pay cheque before anyone forms an opinion
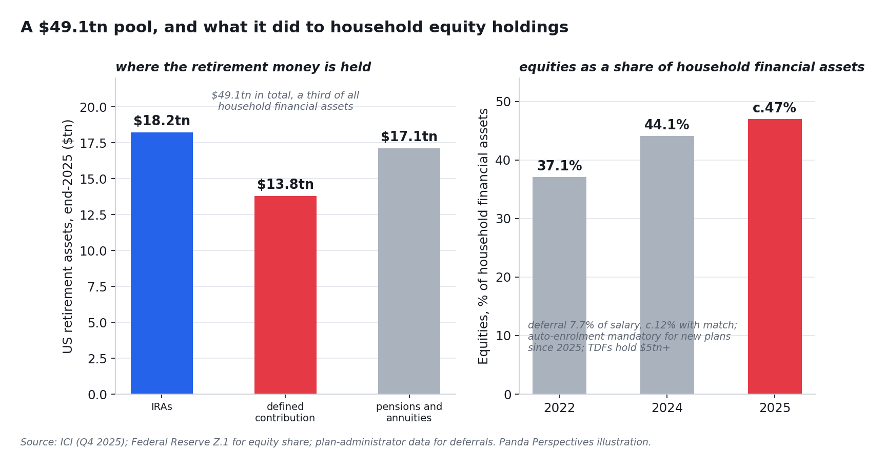
The most interesting factor though to me is behavioural. I particularly want my Chinese readers to appreciate this as I don’t believe this gets enough air time this side of the world. American retirement assets reached $49.1tn at the end of 2025, of which $13.8tn in defined-contribution plans. That’s a lot but China too has a lot of savings, so the mechanics here matter more than the totals. The average 401(k) participant defers 7.7% of salary (not my words, but those of the largest plan administrators as of 2025), this is roughly 12% with the employer match. 61% of plans enrol employees automatically, and since 2025 federal law requires new plans to do so, with contributions escalating automatically each year. Two of every three contributed dollars flow into target-date funds, which hold more than $5tn and buy equities on a schedule regardless of the news. Equities now make up 47% of American household financial assets, the highest reading in the Federal Reserve’s data, and 58% of families own stock. ETF inflows set a record of $1.48tn in 2025, and 2026 is running 87% ahead of that pace.
If there is one thing that I think I need to do a better job of highlighting here is that the important flow in America is passive, but in a different sense of the word. It’s the investment that is automatic, monthly, wage-linked, and committed before the saver in question has formed any opinions about the market. The real shift was from money that never reached the market at all, because participation cost too much and required decisions that took a long time and might have been challenging to fully comprehend. Instead the money now arrives by default. When we add a structural, price-insensitive, wage-linked bid in to the market, and that running given all the other factors we laid out, the outcome cannot possibly be anything but higher prices.
I would go as far as saying that a meaningful slice of the American premium is simply this machine, capitalised. This, incidentally, is exactly what China is trying to replicate, in the fullness of time.
Japan proved the pages work
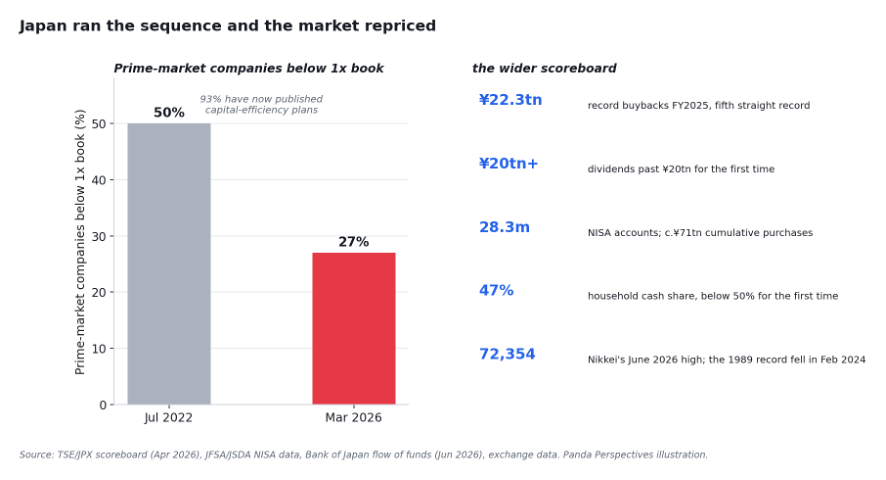
So is any of this repeatable, or is it a uniquely American feature, like the Rodeo? Japan has spent the last few years running the experiment for us. The Tokyo exchange asked its listed companies in March 2023 to publish plans for trading below book value. As of March 2026, 93% of Prime-market companies have disclosed such plans, and the share trading below book has fallen from 50% to 27%. Buyback announcements set a record for the fifth consecutive fiscal year at ¥22.3tn, dividends passed ¥20tn for the first time, and companies unwound ¥9.8tn of cross-shareholdings in a single year, the largest annual disposal yet, to fund some of it.
On the savings side, the expanded NISA scheme reached 28.3m accounts and roughly ¥71tn of cumulative purchases by December. This included a monthly buying record in January. As a result the cash share of household financial assets broke below 50% for the first time in the Bank of Japan’s flow-of-funds data, to 47%, with equities and investment trusts nearing 24%.
Somewhat unsurprisingly, the performance followed. Nikkei finally broke its 1989 record in February 2024, touched 72,354 in June this year, and foreign investors bought a half-year record $60bn of Japanese stock in the first half of 2026. Reform, then payouts, then household flow, then repricing, in that order. The more eagle-eyed Japan followers will point out, not entirely incorrectly, that Tokyo set out to invigorate a mature market. Teaching existing companies to pay their owners is not the same as establishing that ownership and getting profitability up to be able to afford it. Likewise moving existing savings into existing stocks is easier than starting the equity holding culture from scratch. I would still focus on the fact that it worked, and the further behind one is, the bigger the opportunity.
China is building the American machine, at the only scale that can
Which brings us neatly into the realm of my endeavour. You will usually see China’s capital-market programme filed under “following Japan”, and I think the main issue I have with that framing is that it badly undersells the ambition. While the policies do overlap, and the borrowing of details from Tokyo is real on some of them, but this is not the be all and end all. Instead consider what America’s equity market actually is from Beijing’s vantage point: it’s the only complete circuit. Wages flow into savings automatically, savings flow into a deep single-currency market, the market funds the national champions (S&P 500 Constituents, whatever), and the resulting wealth flows back into households and consumption. Running that circuit requires things no country has at once: a continental economy, a savings pool in the tens of trillions of dollars, a technology sector that can absorb the capital, and a state able to rewire the plumbing. Japan, for all its reform success, is renovating a $16tn household balance sheet in a shrinking workforce.
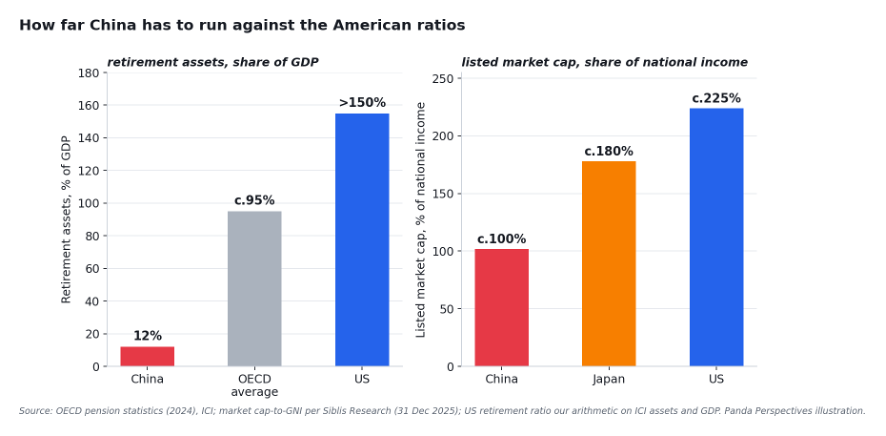
I say no country, but there is one possibility (shock twist). China’s household deposits alone, roughly $22tn, exceed Japan’s entire household asset pool. Its listed market prices at roughly 65% of GDP against America’s 200%, and its retirement pool at 12% of GDP faces an American figure north of 150%. Those gaps are not a bug, but rather are the thesis. This is why I can so confidently say that there is the room to grow into, and only one country has both the scale and the gaps to close.
This is where I would refer you to my previous essay, but for those that aren’t familiar with it, what I’m getting at is the Rmb159tn of household savings deposits earning under 2% real. This is unsustainable and savers want more, and we’re seeing this slowly develop. My current favourite data point is that direct financing passed bank lending for the first time. But we’re seeing green shoots of interest across the board. And we are clearly seeing the government encouraging it. To me it’s both clear and interesting how deliberately the full American model is being implemented.
Let’s take them line by line and go in order I outlined in the earlier part of this.
- Corporate quality: return on equity is now written into state-enterprise performance targets, and the CSRC’s market-value management rule, which requires persistently below-book companies to publish valuation-enhancement plans, was described by one large American asset manager as “almost identical” to Tokyo’s programme.
- Payouts: A-share dividends declared for 2025 reached Rmb2.42tn on exchange data, the highest total yet, with the payout ratio at 44.9%, also a high.
- The investor machine: the big state insurers are mandated to put 30% of new premiums into A-shares; life insurers’ equity allocation has risen for seven consecutive quarters to 10.1% of invested funds on the regulator’s disclosures, the highest since the series began; mutual fund assets reached Rmb39.7tn in June per the fund association, a high for the series; and fee reform has cut fund costs by more than Rmb50bn a year.
- The behavioural shift: it has visibly started too. Central-bank data show households added Rmb7.6tn of new deposits in the first half, Rmb3.2tn less than a year earlier, while deposits at securities and fund institutions grew Rmb2.1tn more. Shanghai turnover set an all-time record in January, and southbound buying of Hong Kong stocks set a record last year and kept running this year.
Being honest with ourselves also means listing what is missing, and the list format makes the gaps easy to see. Executed A-share buybacks were Rmb143bn last year against Japan’s ¥22tn, roughly seven times larger in dollar terms, so China’s payout story remains dividend-led and the buyback leg has barely begun, even with a central bank relending facility built specifically for it. Although, as I write this, the wind may be changing: July’s Rmb67.6bn of announced buybacks was the heaviest month since last spring’s tariff rout, led by CATL’s Rmb40bn plan, the largest single buyback in A-share history. One swallow does not make a summer, but it is the right kind of bird. The personal pension has 70m-plus accounts and thin contributions, and auto-enrolment with auto-escalation, the single most powerful feature of the American machine, does not yet exist in China in any form.
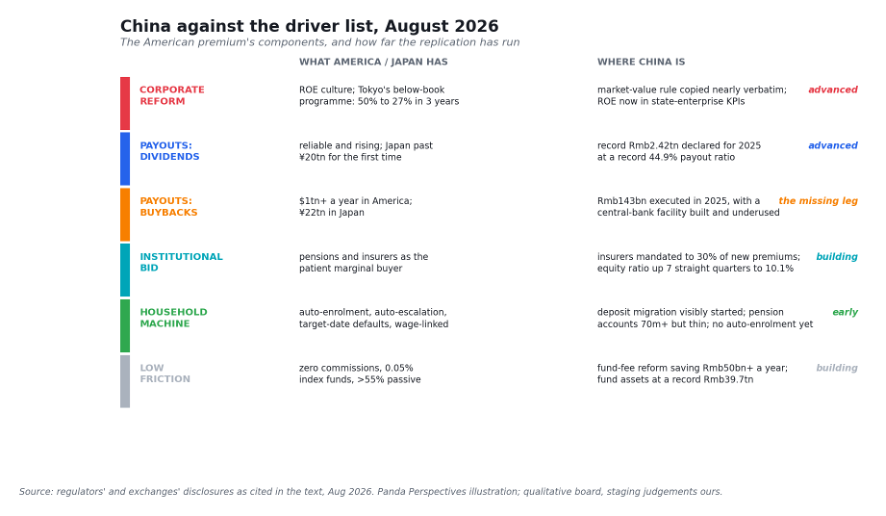
Measured against Japan’s four-stage sequence China stands at roughly stage two. Compared to the American system the distance is far greater, but that the sort of juice that’s well worth the squeeze.
Have a great rest of summer,
Leonid Mironov
for Panda Perspectives
Sources: FactSet (7 Aug 2026), S&P Dow Jones Indices, BEA via FRED, ICI, Federal Reserve Z.1, Ocean Tomo, TSE/JPX disclosure scoreboard (Apr 2026), JFSA and JSDA NISA statistics, Bank of Japan flow of funds (Jun 2026), CSRC, NFRA, PBOC, Wind, Bloomberg, company disclosures, and industry research. Charts are Panda Perspectives illustrations; figures carry their as-of dates in the text.
Nothing in this Substack is investment advice. It is general commentary for a professional readership, it is not a recommendation to buy or sell any security, and it does not take account of your circumstances. Markets carry risk, including the loss of capital. Do your own work.